When it comes to JavaScript there is no better advice than 
A page can be incomplete and still feel fast. It can also be fully downloaded and feel slow. The difference is whether the browser has delivered the code needed for the user’s first task. Bundle size tells us how much code exists. Bundle structure decides which experience arrives first.
In short: JavaScript bundle size is very important but, bundle structure is even more important!
Same app · Same feature set · Different delivery
875KiB. Read-ready in 0.74s.
The fast version did not delete the editor. It stopped making the editor block reading.
Every build, trace, and number below is reproducible. The versions are deployed here and the source is on GitHub.
The experiment
Permalink to "The experiment"Why React?
I used React on purpose because I wanted a JavaScript-heavy baseline and something that renders the DOM in JavaScript.- Monolith: the read UI, CodeMirror, language modes, and editor tools live in one initial file.
- Parallel split: a 264KiB render chunk and a 611KiB editor chunk both start at navigation.
- Lazy editor: the same 264KiB render chunk starts first. The 611KiB editor starts when the user shows edit intent.
I tried to build the example intentionally like this, which comes down to what I see in production code very often, document content is rendered by JavaScript (SPAs), the complex code for editing (validation, WYSIWYG editor and other interactive components) bundled with the view logic.
The conditions under which the test ran:
Compression was disabled for the live race so the raw bundle transfer was easy to see. The absolute timings will change on a production server. The important part is the order of the milestones. See “Methodology and limitations” near the end for how compression, HTTP/2, HTTP/3, and CPU throttling change (and don’t change) that order.
The three apps have their JavaScript code split in the following way:
264KiB
264KiB
What the user sees
Permalink to "What the user sees"Here is the same cold navigation as a filmstrip. It uses LCP from a representative Chromium run because LCP records painted content. This is why a bundle report alone cannot describe the experience.
The cards below use the application’s six-run read-ready mark, not a paint timestamp:
The edit waits above come from clicking Edit immediately after the read-ready mark. That is a deliberately harsh case for the split builds. If the user reads for about a second first, the parallel editor is already available by the time they click.
Navigation to usable milestones
Why parallel splitting can beat one file
Permalink to "Why parallel splitting can beat one file"The parallel version sends almost the same startup bytes as the monolith. It reaches read-ready about 740ms sooner.
Both requests started together: within 0.2ms in Chromium and 2ms in Firefox. They shared the same simulated aggregate bandwidth limit.
The dependency boundary lets the smaller app finish, compile, and run without waiting for CodeMirror and its language modes. The traces below show exactly where that time goes.
Download, parse, compile, evaluate
Permalink to "Download, parse, compile, evaluate"I recorded a fresh Chromium trace under the same Fast 4G server profile and matched Resource Timing entries with V8 trace events. The values below come from that single trace, so they differ slightly from the six-run medians above.
The important detail is overlap. V8 starts its streaming parse task when response bytes arrive, and it does that work on a background thread instead of the main thread. The task stays open while the download continues, mostly waiting for the next network chunk. Chrome records both wall time and thread CPU time, which lets us separate “the parser existed for 1.7 seconds” from “the parser used 25ms of CPU.”
Chromium trace · 2.1 second scale
| Trace event | Body download | Parse task CPU | Nested background compile CPU | Evaluate wall span |
|---|---|---|---|---|
| Monolith app | 1,760.0ms | 24.7ms | 2.07ms | 36.3ms |
| Parallel app | 1,040.3ms | 6.4ms | 0.45ms | 11.0ms |
| Parallel editor | 1,742.2ms | 17.6ms | 1.43ms | Not evaluated yet |
| Lazy app | 519.3ms | 5.9ms | 0.41ms | 11.0ms |
The background compile event is nested inside the parse task CPU, so those columns should not be added. Main-thread module finalization took less than 0.1ms in every app trace.
demo:read-ready is a requestAnimationFrame marker after React commits. It is a stable application milestone, not an exact paint timestamp. The browser’s LCP marker is the better metric when the exact painted frame matters.
This reconstructs the parallel win more precisely:
- The parallel app finished downloading at 1.230s.
- Its streaming parse and background compile finished at 1.231s.
- Module evaluation ran from 1.232s to 1.243s.
- React emitted the read-ready mark at 1.263s.
- The editor did not finish downloading and parsing until about 1.974s.
That module boundary let the render chunk run on its own 732ms earlier than the monolith.
Watching it happen in Perfetto
Permalink to "Watching it happen in Perfetto"I like to profile Chromium in Perfetto as at give me a window into what the V8 is doing, in this case I can see the compile and parse, also the threads on which it is happening.

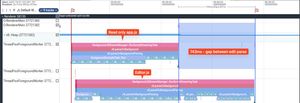
This is the mechanical reason splitting helps even when both requests start together. It is not only that the read chunk is smaller; the browser can hand each file to its own worker thread the moment bytes for that file arrive, so the two parses genuinely overlap instead of queuing behind each other.
Firefox confirms the same ordering
Permalink to "Firefox confirms the same ordering"The saved Firefox Nightly profiles show the same ordering. The profiler cannot separate parse from compile CPU here, so these are wall-clock compile windows.
| Firefox trace | Response body | Off-thread compile window | Evaluate wall span | Read-ready |
|---|---|---|---|---|
| Monolith app | 1,758.9ms | 36.7ms | 20.9ms | 2,138.2ms |
| Parallel app | 1,042.0ms | 9.5ms | 3.1ms | 1,283.3ms |
| Parallel editor | 1,744.5ms | 38.9ms | Not evaluated | After read-ready |
| Lazy app | 534.2ms | 9.9ms | 3.1ms | 759.7ms |
At the parallel page’s read-ready mark, the editor still had 711ms of download left. Its compile window did not begin until another 713ms after that mark. Firefox cannot give us a defensible parse-only CPU number from this profile, but it clearly shows the smaller app compiling and evaluating while the editor remains off the critical path.
Parallel does not mean free bandwidth. The trace used separate HTTP/1.1 connections, but both competed for the same simulated 4Mbps aggregate bandwidth. That is why the lazy render chunk finished faster than the parallel render chunk.
A separate representative run showed the same order in both browser engines:
| Read-ready | Chromium | Firefox |
|---|---|---|
| Monolith | 2,013ms | 2,125ms |
| Parallel split | 1,280ms | 1,279ms |
| Lazy editor | 746ms | 756ms |
This is the useful middle case that bundle-size discussions often miss. You can improve perceived performance without reducing total startup bytes, as long as the split lets the browser complete useful work sooner.
What if editing is the first task?
Permalink to "What if editing is the first task?"The answer changes.
I ran a second experiment where JavaScript renders the document and then attaches inline editing. An edit probe fires 150ms after the content-rendered application mark. This models a document editor or an inline-edit screen where the user may interact immediately.
The third build here is not the lazy editor from the first experiment. It is an after-render split: the interaction layer starts downloading as soon as the content is on screen, without waiting for an intent signal. Nobody has to hover anything for it to load.
Content-rendered mark and inline editing
The result is more nuanced:
- Parallel split: the content-rendered mark arrived 760ms sooner and editing became ready at almost the same time as the monolith. The edit probe waited 625ms.
- After-render split: the content-rendered mark arrived 1.21s sooner, but editing became ready 200ms later than the monolith. The edit probe waited 1.29s.
The after-render version reaches its content mark quickly, then makes an early editor action wait. That is still a good trade when most people read first. It is the wrong trade when the page’s main job is immediate editing.
Split the editor again
Permalink to "Split the editor again"“Read” and “edit” are often too broad as bundle boundaries. Immediate inline editing may need a small amount of code. A full editor may also include syntax highlighting, search, autocomplete, language parsers, collaboration, history, and command palettes.
Those do not all need to become interactive at the same moment.
Create the document, layout, and readable content.
Selection, basic input, focus, save, and visible feedback.
Language modes, autocomplete, command palette, diff tools, and plugins.
The code boundary can follow the same shape:
import { renderDocument } from "./render-document.js";
import { enableInlineEditing } from "./inline-editing.js";

renderDocument();
enableInlineEditing();

const loadAdvancedEditor = () => import("./advanced-editor.js");

editButton.addEventListener("pointerenter", loadAdvancedEditor, { once: true });
editButton.addEventListener("click", loadAdvancedEditor);
This keeps the first required interaction honest without putting every editor feature back into the initial bundle.
Choose the split from the first task
Permalink to "Choose the split from the first task"Ship the render path first. Load the editor on hover, focus, or another intent signal.
Let content finish first while the editor downloads in the background.
Put essential interaction on the critical path. Defer only advanced tools.
This is why “always lazy-load the editor” is not a useful rule. The correct boundary depends on what the user came to do.
Methodology and limitations
Permalink to "Methodology and limitations"This experiment is intentionally simple: one page, one navigation, a render chunk and an editor chunk. That’s the point. The conclusion comes from years of seeing the same shape in production, document content rendered by JavaScript, with a much heavier editing layer bundled in alongside it, not from a network trick.
To be sure the network conditions weren’t doing the work, I cross-checked compression, HTTP/2 and HTTP/3, CPU throttling, and run-to-run variance in a separate controlled re-test. The raw CSVs and trace notes are in the demo repo’s methodology-appendix folder. Every one of them confirms the same thing: the win is bundle structure, not transport or hardware.
- Compression was off above on purpose so the raw byte transfer would be visible. With real brotli enabled end-to-end, both the monolith and the split chunks compress to about a quarter of their original size, compression does not disproportionately favor the monolith the way it’s easy to assume. It narrows the gap, because everything gets faster, but the split build never lost.
- The demo serves plain HTTP/1.1. I stood up an HTTP/2 server and an HTTP/1.1+TLS control server side by side and could not find a meaningful difference between them for this page, across repeated cold-connection runs. That’s expected: HTTP/2 and HTTP/3’s multiplexing pays off when a page requests many small files at once. This page requests one or two.
- The main test throttles network, not CPU. Adding a 4x CPU slowdown on top of the same network profile barely moved the monolith’s timing, at this bandwidth, download time so thoroughly dominates that parse and compile are a rounding error. It moved the smaller render chunk’s timing proportionally more, since parse/compile is a bigger share of a shorter load. Real, but secondary, effect.
- The charts above show medians, not spread, and the spread isn’t uniform. The monolith’s timing is tight and repeatable, because it’s dominated by a large, slow download. The small render chunk’s timing swings much more from run to run, because a fixed cost like a TLS handshake is a much bigger fraction of a short total. If you rerun this yourself, expect the large-bundle numbers to be boring and the small-bundle numbers to jump around, that’s the network being small-sample-noisy, not a bug in the test.
- Every run used a cold cache a unique URL and
Cache-Control: no-store. If the exact same file ships unchanged, a returning visitor’s warm V8 code cache lets the monolith skip most of its compile cost, so this article’s numbers are specifically about the first visit, before that cache exists. That said, this cuts both ways over the life of a real app: ship a fix to the editor and the monolith invalidates one large file, cold-compiling the whole thing again, while the split build only invalidates the editor chunk, the render chunk’s cache, and its warm compile, survive the deploy. Splitting doesn’t just help the first visit, it also gives you a more granular cache to lose.
Measure milestones, not only bytes
Permalink to "Measure milestones, not only bytes"A bundle analyzer can show where the code went. It cannot tell you whether the chosen boundary improved the experience.
Mark the moments users actually feel:
performance.mark("content-rendered");
performance.mark("basic-interaction-ready");
performance.mark("advanced-editor-ready");
Then test the action too. Click Edit immediately, after 500ms, and after a realistic reading delay. Run cold-cache trials, compare medians, and inspect the request and compile traces.
The useful questions are:
- When can the user see meaningful content?
- When does the first likely action work?
- How long does an early action wait?
- What downloads and compiles before those milestones?
The best split is not the one with the most chunks or the smallest entry file. It is the one that gets the code for the first useful experience to the browser first.
Comments
Join the discussion via GitHub Discussions.